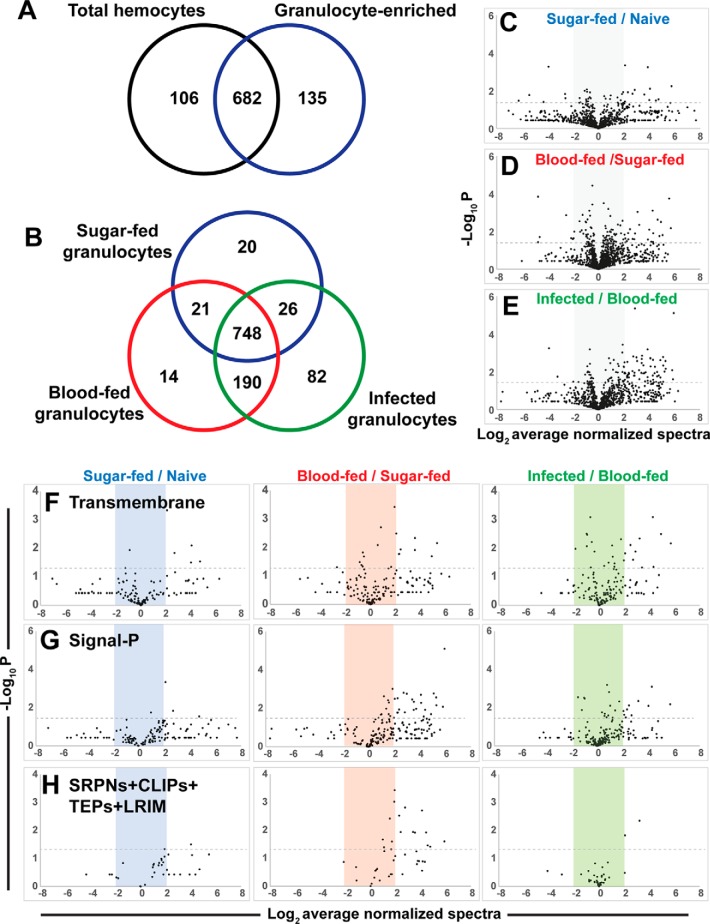
Fig. 2.
Proteomic analyses of phagocytic hemocyte populations. Venn diagram comparisons of protein identities from three independent biological replicates of mosquito hemocyte proteomes following granulocyte enrichment from total hemocyte populations (A) or comparing granulocyte proteomes in response to feeding status (naïve sugar-fed, blood-feeding, or Plasmodium infection) (B) are shown. Volcano plots of label-free relative quantitative analyses of protein abundance by average normalized spectral counts from three biological replicates (C–E). The three graphs depict total proteins from each sample versus the appropriate reference sample according to feeding status. Levels of predicted transmembrane proteins (F), secreted proteins (G), and a combination of immune gene families (SRPNs, CLIPs, TEPs and LRIMs) (H) were measured across each of the respective treatments (phagocytosis, blood-feeding, and infection). All values are depicted as the Log2 average of normalized spectra, whereas significance (p value) is measured as the -Log10. Dotted lines depict significance with a p value cutoff of 0.05.

