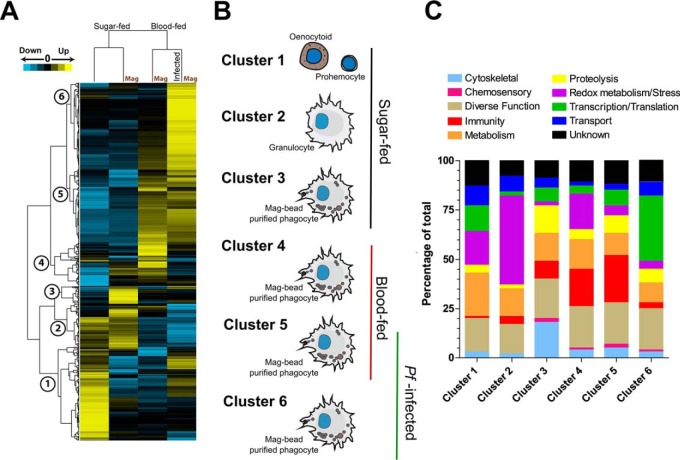
Fig. 3.
Clustering analyses reveals expression patterns indicative of feeding status and infection. Proteomic data from each sample treatment was clustered into six distinct coexpression clusters based on protein abundance (A). The analysis clearly defined feeding status (sugar- or blood-fed) into two distinct clades. B, Visual representations display information regarding cell type and feeding status for each cluster group. Proteins associated with each cluster reveal distinct distributions of molecular function groups (C).

