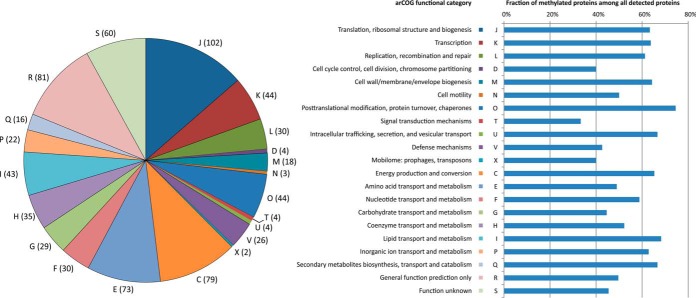
Fig. 3.
Functional annotation of the identified methylated proteins. Pie-chart on the left shows the classification of identified methylated proteins according to functional categories, as defined in the archaeal clusters of orthologous groups (arCOG) (46, 47). The numbers in parenthesis indicate the exact number of identified methylated proteins in each category. The categories are denoted by capital letters and the key is provided in the right panel. Horizontal bars show the proportion of methylated proteins among all detected proteins in each functional category.

