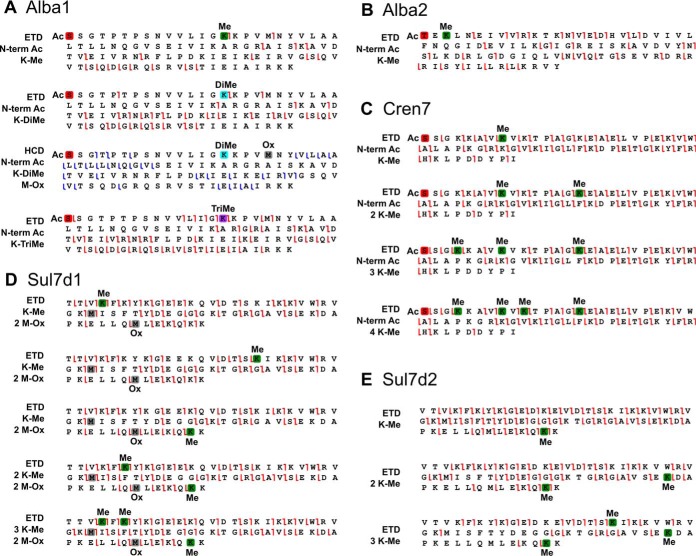
Fig. 5.
Fragmentation maps, showing localization of methylations and acetylations on the main S. islandicus methylated chromatin protein forms by ETD or HCD MS/MS. A, Alba1 proteoforms; B, Alba2 proteoforms; C, Cren7 proteoforms; D, Sul7d1 proteoforms, E, Sul7d2 proteoforms. Red box represents N-terminal acetylation; green box, lysine methylation; light blue box, lysine dimethylation; violet box, lysine trimethylation; gray box, methionine monooxidation.

