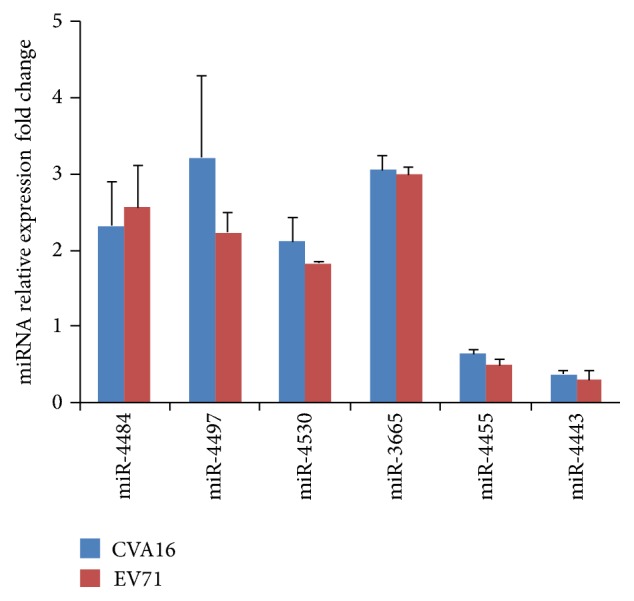
Figure 2.

Quantitative RT-PCR was performed to examine the expression of miRNAs in virus-infected cells. The expression levels were normalized to endogenous U6 small RNA. Fold change compared with control cells was calculated using the equation 2−ΔΔCt. The data was presented as mean ± SD. Six miRNAs (miR-4484, miR-4497, miR-4530, miR-3665, miR-4455, and miR-4443) exhibited significant fold changes in expression levels (P < 0.05).
