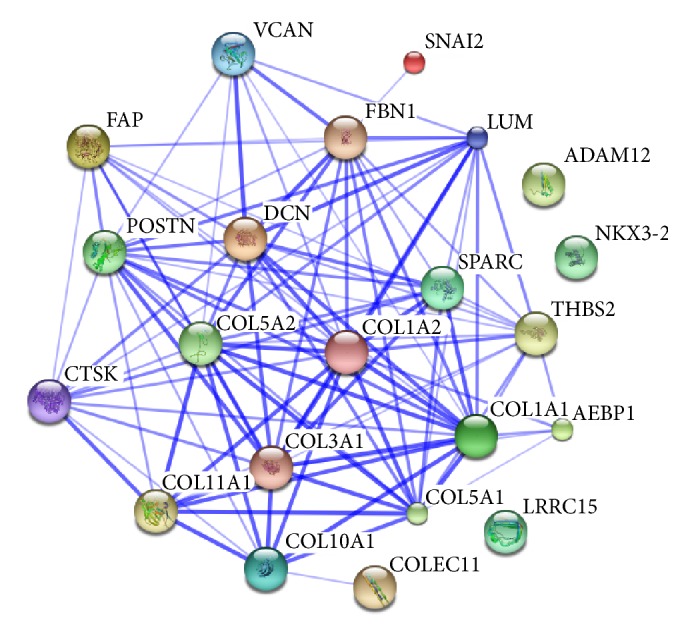
Figure 3.

Known and predicted protein-protein interactions with the 22 genes on the subnetwork of Figure 2, where nodes represent proteins (genes) and edges indicate the direct (physical) and indirect (functional) associations. Stronger associations are represented by thicker lines.
