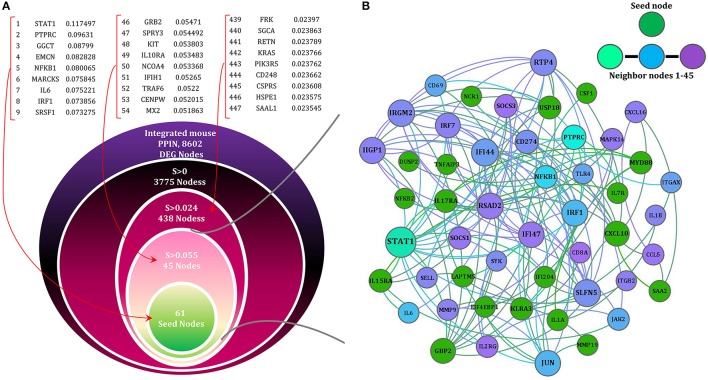
Figure 3.
The network (SHIDEG-PPIN) onion diagram. (A) Identification of the rabies disease neighborhood network based on proximal nodes of the seed gene set. The PPIN of all DEG products (8602/9162) existed in STRING were ranked on the basis of their shortest path (SP) score with the 61 rabies SHIDEGs as seed nodes. Selecting various score cutoffs (99.5th, 95th and 56th quantiles) allow neighborhoods of various sizes to be defined as shown in the nested circles. The ranked list of neighbors of seed nodes demonstrated with their scores. (B) The minimized PPIN formed with the confident interactions (0.4 cut-off selected based on the TOM procedure) between the 61 seed nodes (green) and top 45 ranked proximal nodes (range of colors from cyan to purple) is shown at the top with node size representing degree of nodes.

