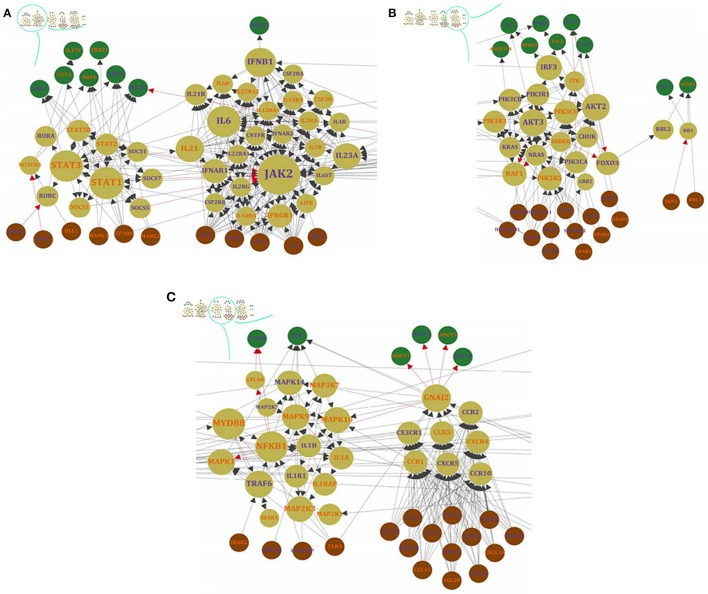
Figure 5.
A bird's eye view of RISN. The 22 over-expressed genes of significantly enriched KEGG pathways were selected and merged. The DEGs are labeled by different colors including orange and blue which indicates down-regulation and up-regulation of genes, respectively. The activator/inhibitor edges are also colored differently (red edges are inhibitors and black vice versa). The node colors represent its relative position in a directed network from brown (source nodes), cream (internal nodes) to green (sink nodes) and the node size is proportional to betweenness centrality value. In addition, the six detected modules in three parts are displayed separately: (A) Interferon circumvent, (B) Toward proliferation and survival, and (C) neuropathological clue.

