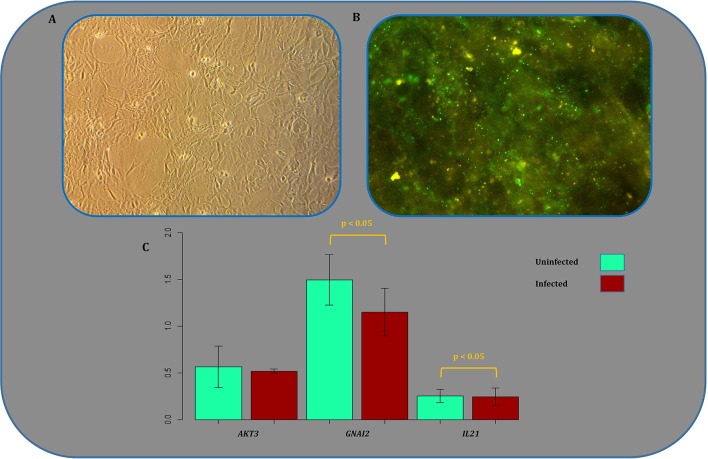
Figure 7.
Experimental validation of microarray-based expression results. (A) Mock infected N2a cell culture image showing a normal morphology. (B) N2a cells infected with CVS strain of RABV with multiplicity of infection (MOI = 3), stained by FITC conjugated anti-rabies nucleocapsid polycolonal antibody. The images were captured 24 h post infection. (C) Expression profile of three randomly selected genes acting in different signaling pathways of the rabies-implicated signaling network (RISN). Expression levels were quantified using RT-qPCR in triplicates. The error bar plots indicate Mean ± SD and include the corresponding p-value of the statistical significance test. The vertical axis measures the negative inverse value of the logarithm of the mean value for each replicate using the delta Ct method.

