
Figure 4. Increased expression of profibrogenic markers in TSC1 CKO mice.
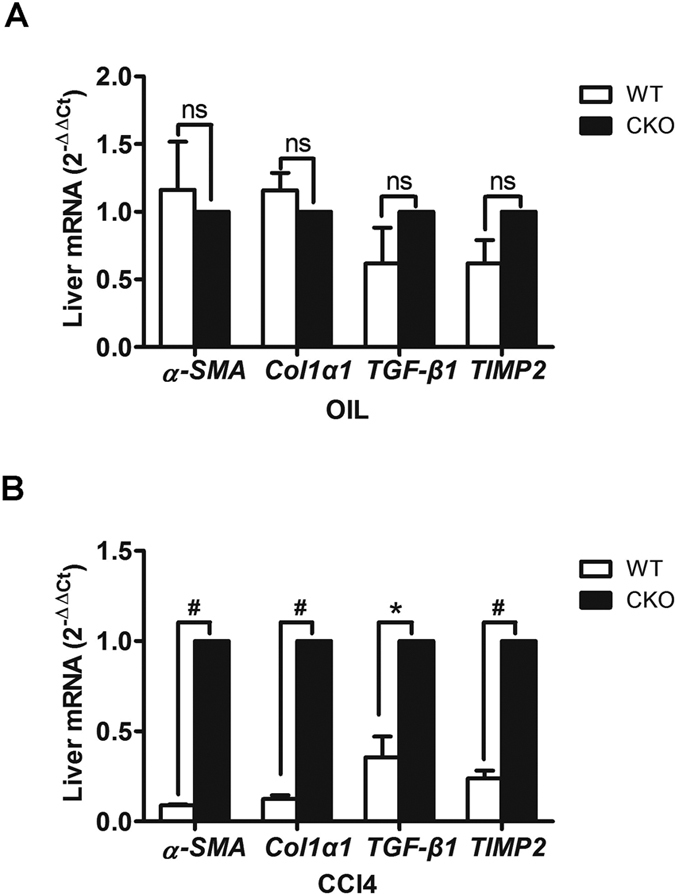
(A) Expression levels of α-SMA, Col1α1, TGF-β1, and TIMP2 were assessed by RT-PCR 8 weeks after treatment with oil. (B) Expression of α-SMA, Col1α1, TGF-β1, and TIMP2 were assessed by RT-PCR 8 weeks after treatment with CCl4. Expression was normalized to the levels of GAPDH and results are presented as the mean ± SEM derived from three independent experiments. NS, p > 0.05; *p < 0.05; #p < 0.01 for TSC1 CKO vs. WT mice.