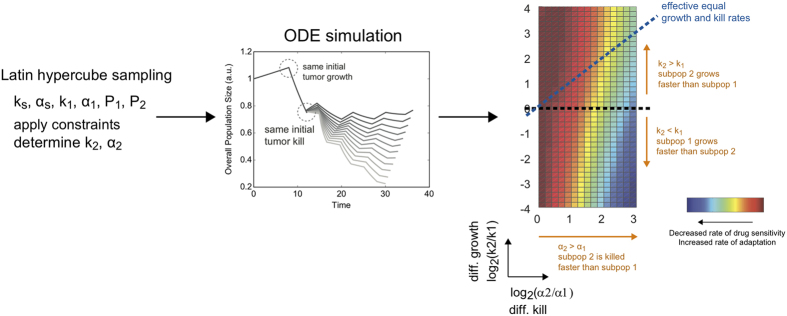
Figure 2. Analysis procedure to identify parameter regimes with high/low therapeutic efficacy.
Latin hypercube sampling was performed on the following parameters: overall growth rate (ks), overall kill rate (αs), growth rate (k1) and kill rate (α1) of subpopulation 1, and the initial fraction of each subpopulation ( and
and  ). See Supplementary Table S1 for the parameter range used. Provided with the constraint of equal tumor burden and tumor reduction following first round of treatment, we derived the corresponding growth rate (k2) and kill rate (α2) of subpopulation 2. For each given parameter set, we ran the ODE simulations and derived therapeutic metrics (tumor size, percent tumor reduction, and rate of change in tumor sensitivity). This was visualized on a two-dimensional heatmap of differential growth (k2/k1) versus differential killing
 .
.

