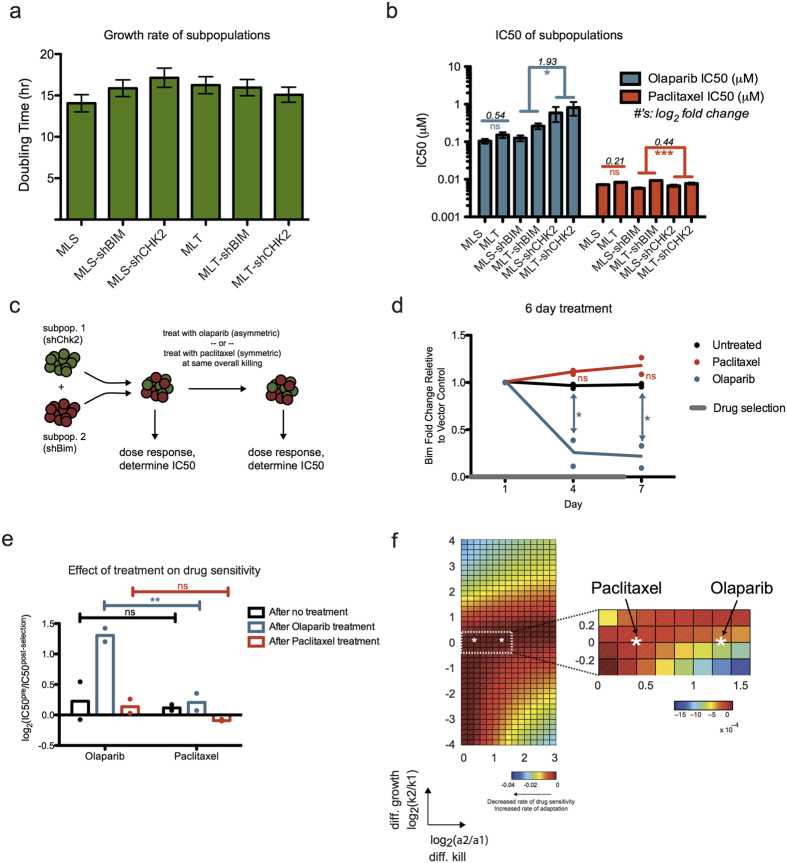
Figure 5. Experimental validation of ‘symmetric’ and ‘asymmetric’ treatments on Eμ-myc tumor cells.
(a) Parental murine Eμ-myc; p19Arf−/− cell line was transduced with different shRNA hairpins. The bar plot shows the measured net growth rate of the individual cell lines. Data were compiled from three replicates at seven time points. Data is shown as mean ± SEM. No significant difference was observed between any of the growth rates (one-way ANOVA). (b) Corresponding IC50s (derived from a 12-point dose response curve, with error bars indicating SEM from model fit) for the individual cell lines upon treatment with olaparib or paclitaxel. For vector controls, IC50 fold change of MLT/MLS is shown. For shChk2/shBim, the geometric mean in magnitude of IC50 fold change between shChk2 and shBim is shown. ns, not significant, *P < 0.05, **P < 0.01, ***P < 0.001 (ANOVA with Bonferroni post-test. p-values for shBim and shChk2 were combined with Fisher’s Method). (c) Schematic of the drug selection on an admixed tumor population. Cell lines with shChk2 or shBim were mixed in a 1:1 ratio. IC50s of the cell populations in response to different drugs were determined from dose responses performed pre- and post- drug selection. (d) Enrichment/depletion of the shBim fraction relative to the empty vector control and normalized to day 1 shBim fraction over the course of drug selection. Olaparib treatment led to significant depletion of the shBim subpopulation. Data were compiled from two independent experiments. Averages shown as lines, individual replicate values shown as points. ns, not significant, *P < 0.05 (one-way ANOVA with Bonferroni post-test). (e) Comparison of shBim/shChk2 populations’ change in drug resistance after symmetric (paclitaxel) or asymmetric (olaparib) treatment. This is calculated here as log2 fold change in IC50 between pre- and post- treatment. Data were compiled from two independent experiments. Averages shown as bars, individual replicate values shown as points. ns, not significant, **P < 0.01 (two-way ANOVA with Bonferroni post-test). (f) Parameterization of the mathematical model with experimentally derived parameter set (see Table S2) denoted by the white asterisk in the parameter space. Heatmap with the closest match to experimentally derived parameter values was based on αs = 0.01 hr−1 and ks = 0.05 hr−1. Per both computational modeling and experimental results, the asymmetric olaparib treatment led to higher rate of adaptation.

