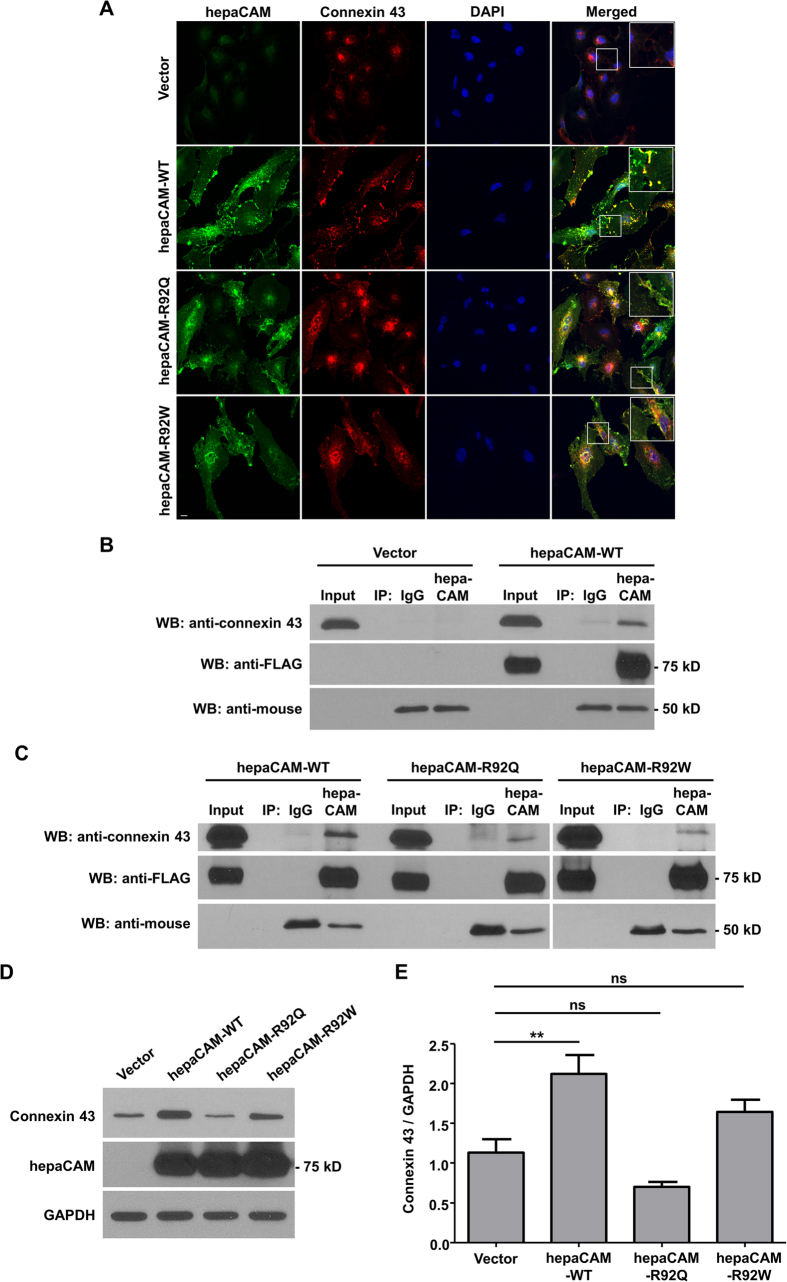
Figure 1. HepaCAM associates with connexin 43.
(A) U373 MG cells were stably transfected with pcDNA3.1 vector, wild-type hepaCAM, hepaCAM-R92Q and hepaCAM-R92W. Immunofluorescent staining was performed with antibodies against the hepaCAM cytoplasmic domain (green) and connexin 43 (red). Co-localization of hepaCAM and connexin 43 is indicated by yellow fluorescence. Nuclei were stained with DAPI (blue). Insets show a higher magnification of sites of cell-cell contacts. Cells were visualized by confocal microscopy under a 60× objective. Scale bar: 10 μm. (B) Co-immunoprecipitatation of connexin 43 and hepaCAM. Cell lysates were prepared from U373 MG cells stably transfected with pcDNA3.1 vector and wild-type hepaCAM, and immunoprecipitated with antibody against the hepaCAM extracellular domain (IP hepaCAM). Immunoprecipitation with mouse IgG1 (IP IgG) was included as a negative control. Western blot analysis was performed on the immunoprecipitates and input (3%) using connexin 43 antibody. The efficiency of hepaCAM immunoprecipitation was evaluated with an HRP-conjugated FLAG antibody. The IgG heavy chain detected with an HRP-conjugated anti-mouse antibody is shown as a loading control. (C) Co-immunoprecipitation of wild-type and mutant hepaCAM with connexin 43. Cell lysates were immunoprecipitated with antibody against the hepaCAM extracellular domain (IP hepaCAM). Immunoprecipitation with mouse IgG1 (IP IgG) was included as a negative control. Western blot analysis was performed on the immunoprecipitates and input (2%) using connexin 43 antibody. (D) Expression of wild-type hepaCAM increases connexin 43 protein levels in U373 MG cells. 20 μg of cell lysates were subjected to Western blot analysis. GAPDH was used as a loading control. The result presented is a representative experiment of four independent experiments with similar results. The full view blots are shown in Supplementary Figure 1. (E) Quantification of connexin 43 protein levels in D and in three additional independent Western blot analyses. Using ImageJ the densities of the connexin 43 bands were normalized to the densities of the respective GAPDH bands for each sample, and the mean relative density over the four experiments was calculated. The data presented are the means ± SE (n = 4), **p < 0.01 as assessed by one-way ANOVA with Tukey’s multiple comparison test.

