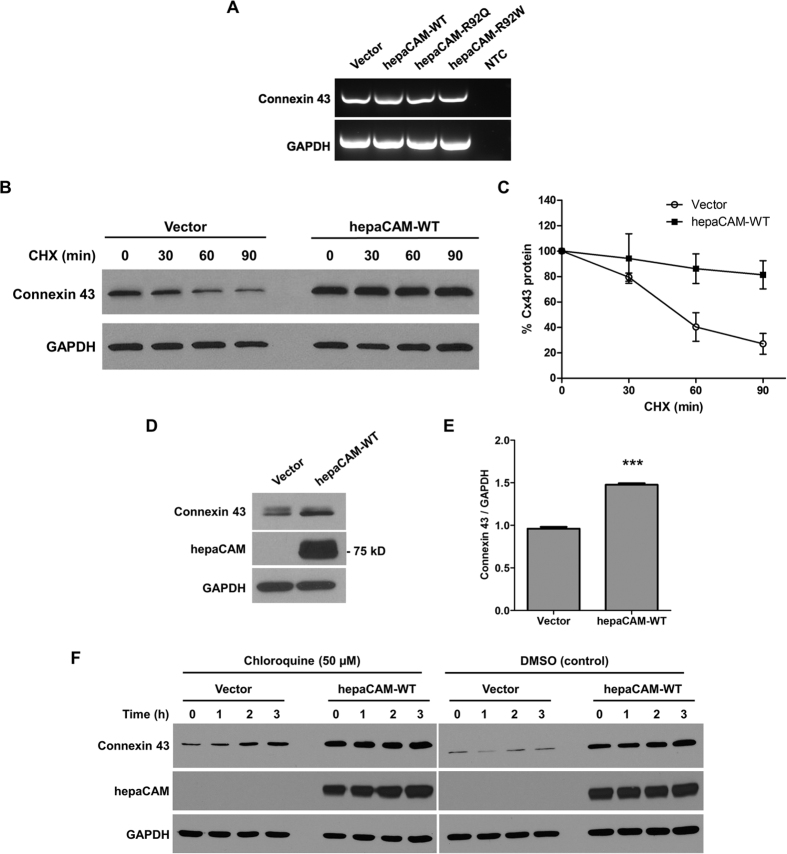
Figure 3. HepaCAM regulates connexin 43 stability.
(A) Evaluation of connexin 43 mRNA expression. Total RNA was analyzed by RT-PCR. GAPDH and no template controls (NTC) were included as housekeeping gene and negative controls, respectively. (B) Evaluation of connexin 43 protein stability by a cycloheximide (CHX) chase assay. Cells treated with CHX (50 μg/ml) for the times indicated were lysed and 30 μg of cell lysates were subjected to Western blot analysis. The result presented is a representative experiment of three independent experiments with similar results. (C) Quantification of all three CHX chase experiments using ImageJ. The densities of the connexin 43 bands were normalized to the densities of the respective GAPDH bands at each time-point. The level of connexin 43 remaining at each time-point was calculated as a percentage of the initial connexin 43 level (time 0 of CHX treatment). The data presented are the means ± SE (n = 3). (D) Expression of hepaCAM in HEK293T cells increases connexin 43 protein levels. HEK293T cells were transiently transfected with pcDNA3.1 vector or wild-type hepaCAM. Two days after transfection, cells were lysed and 60 μg of cell lysates were subjected to Western blot analysis using antibodies against connexin 43 and the hepaCAM extracellular domain. The result presented is a representative experiment of three independent experiments with similar results. (E) Quantification of all three experiments using ImageJ. The densities of the connexin 43 bands were normalized to the densities of the respective GAPDH bands for each sample, and the mean relative density over the three experiments was calculated. The data presented are the means ± SE (n = 3), ***p < 0.0001 as assessed by t-test. (F) HepaCAM slows down connexin 43 turnover by the lysosomal pathway. U373 MG cells stably transfected with pcDNA3.1 vector or wild-type hepaCAM were treated with chloroquine (50 μM) and 30 μg of cell lysates were subjected to Western blot analysis for connexin 43. The result presented is representative of two independent experiments with similar results. The full view blots for (B,D,F) are shown in Supplementary Figures 3,4 and 5, respectively.

