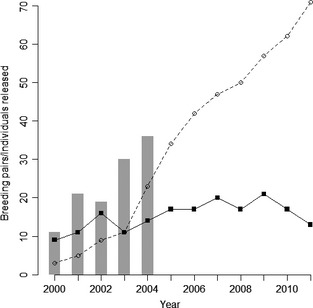
Figure 1.

Total numbers of released individuals (grey bars) and breeding pairs per year during the 12‐year study period. Dashed lines and open circles represent breeding pairs which took supplementary food whilst solid lines and filled circles those which did not.
