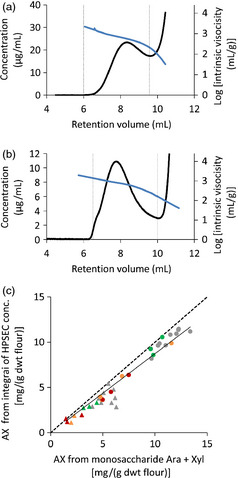
Figure 1.

HPSEC analysis of AX extracts from wheat endosperm samples. (a, b) Profiles of concentration (black line) and log intrinsic viscosity (blue line) for WE‐AX (a) and AE‐AX (b) from wild‐type Cadenza flour. Limits for integration calculation are shown (vertical dashed lines); these were maintained the same for all samples. (c) Comparison of integrated concentration from HPSEC profiles with Ara + Xyl content in same samples for GT43_2 RNAi (red symbols), GT47_2 RNAi (orange), XAT1 RNAi (green) and null segregant controls (grey). Triangles are WE‐AX extracts; circles are AE‐AX. Solid line is regression through all points (y = 0.87 x; R 2 = 0.95); dashed line is y = x.
