
Figure 4.
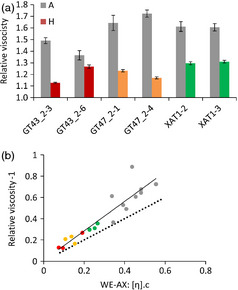
Relative viscosity of water extracts from endosperm samples. As relative viscosity is expressed relative to water, theoretical minimum value is 1. (a) Means ± SE (n = 4) grey columns azygous controls, coloured columns homozygous samples. (b) comparison of relative viscosity ‐1 with theoretical relationship predicted from the intrinsic viscosity [η] and amount of WE‐AX estimated for these samples from values in Table 2. Concentration c is given by WE‐AX mg/(g flour) × 0.25 g flour/mL. Symbols are as in Fig. 1C; solid line is y = 1.38x + 0.01 from regression, R 2 = 0.85; dashed line is y = x representing perfect agreement between theoretical and observed.