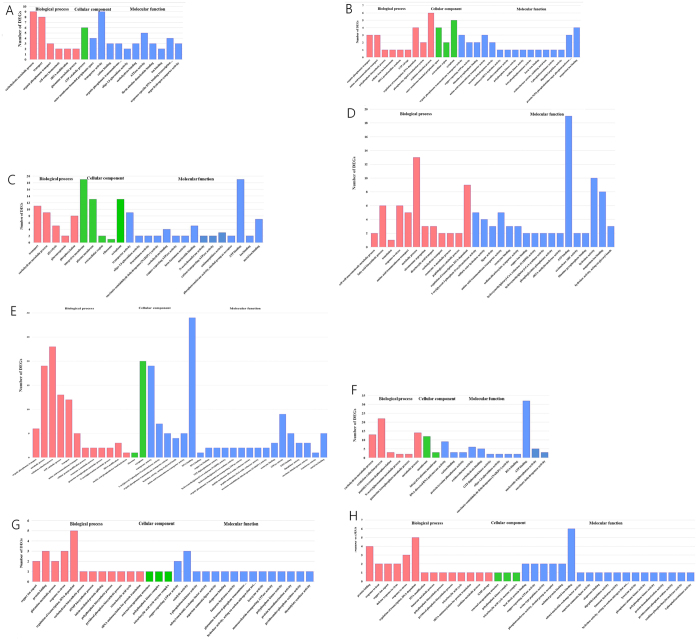
Figure 3. Significantly enriched GO terms of differentially expressed genes.
The y-axis denotes the number of genes in a category. The x-axis represents the significantly enriched GO terms. (A) BM-LA14526 normal state versus BM-LA14526 mid-term state, (B) BM-LA14526 normal state versus BM-LA14526 VPNC state, (C) BM-LA14526 mid-term state versus BM-LA14526 VPNC state, (D) BM-LA14527 normal state versus BM-LA14527 mid-term state, (E) BM-LA14527 normal state versus BM-LA14527 VPNC state, (F) BM-LA14527 mid-term state versus BM-LA14527 VPNC state, (G) BM-LA14528 normal state versus BM-LA14528 mid-term state, (H) BM-LA14528 normal state versus BM-LA14528 VPNC state. The statistic graphs of BM-LA14528 mid-term state versus BM-LA14528 VPNC state group is omitted since no significantly enriched GO terms.

