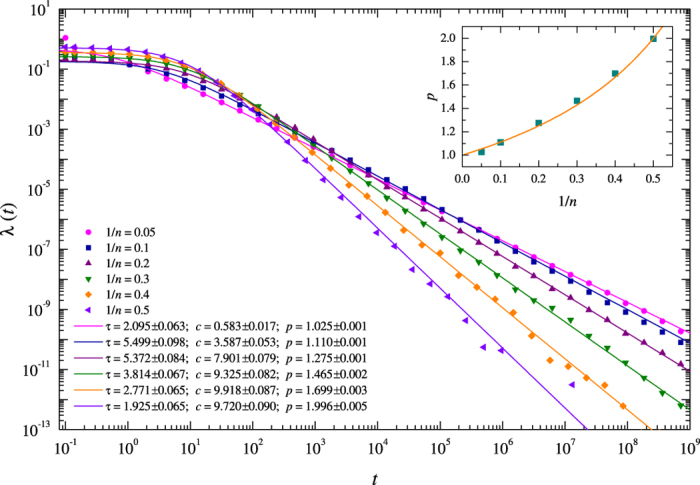
Figure 3. Aftershock decay rates for the model on a 256 × 256 lattice with α = 0.24, β = 0.23, q0 = 10.0, and varying 1/n parameters.

Aftershocks larger than s ≥ 10 are used. The maximum likelihood fits of Equation (1) to the rates are given as solid curves and the resulting fitting parameter values are reported in the legend within 95% confidence intervals. The inset gives the dependence of the exponent p in Equation (1) on the model parameter 1/n, which defines the degree of viscoelastic nonlinearity. The solid curve corresponds to the theoretical dependence of the power exponent of the stress decay rate on n, which is given in Equation (9).
