
Figure 2.
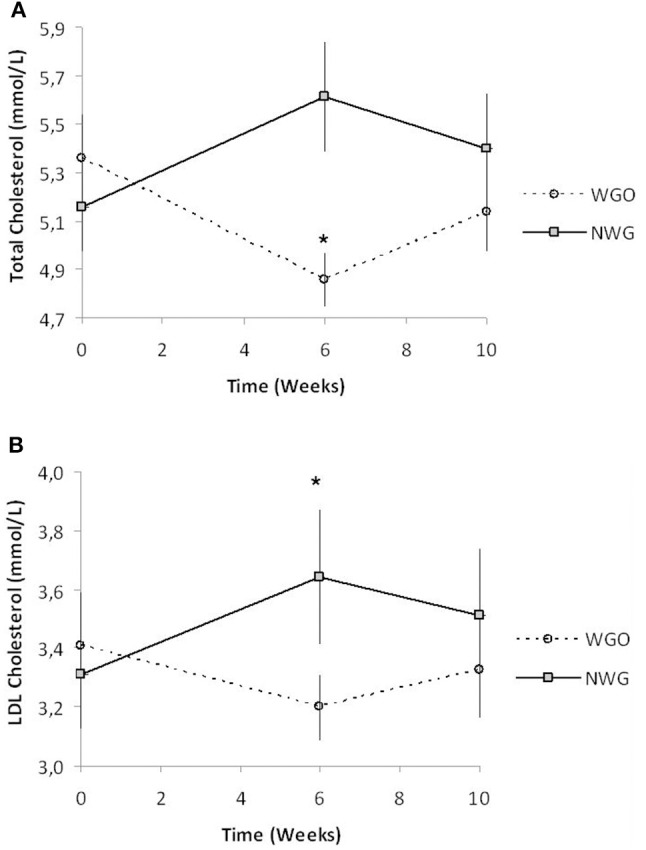
TC and LDL-C concentrations in fasted blood plasma over the trial period for both cereal treatments (n = 30). (A) TC and (B) LDL-C. * Significantly different from baseline (P <0.05, Tukey's post-test).
Official websites use .gov
A
.gov website belongs to an official
government organization in the United States.
Secure .gov websites use HTTPS
A lock (
) or https:// means you've safely
connected to the .gov website. Share sensitive
information only on official, secure websites.
TC and LDL-C concentrations in fasted blood plasma over the trial period for both cereal treatments (n = 30). (A) TC and (B) LDL-C. * Significantly different from baseline (P <0.05, Tukey's post-test).