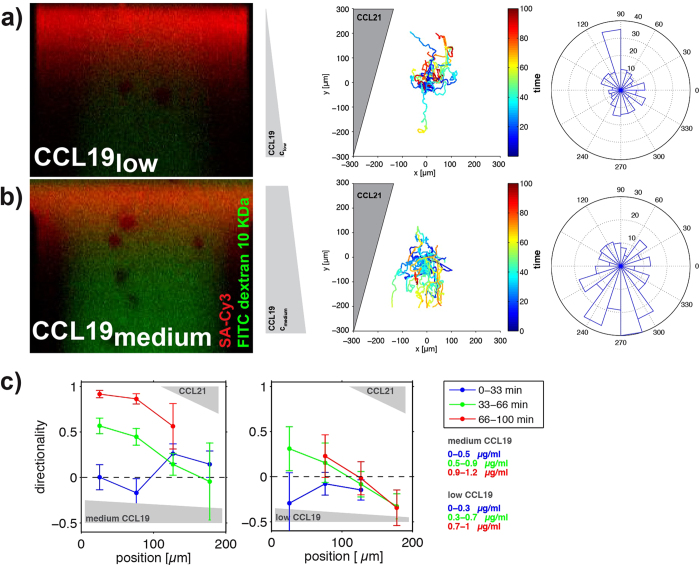
Figure 5. DCs migrating on opposing chemotactic CCL19 and haptotactic CCL21 gradients.
(a) CCL19low/CCL21 area of the chamber. (b) CCL19medium/CCL21 area of the chamber. Left panel: Representative images of the soluble CCL19/FITC dextran 10 kDa gradient (green) after 45 min superimposed with immobilized CCL21/SA-Cy3 gradients (red) of the respective areas. Middle panel: Tracks of migrated DCs in the respective areas aligned to the origin [dimensions in μm; time is colour-coded]. Gradient directions are indicated in grey. Right panel: Rose plot visualizing the distribution of angles of all tracks in an angular sector field (3 min intervals). (c) Directionalities as a function of the position in the channel for intermediate and low average concentrations of CCL19 (from left to right). Zero position corresponds to the lower edge of the field of view, and the directionalities are shown in blue, green, and red for short, intermediate, and long times. As in Figure 4, the concentration ranges per time span are indicated in the corresponding colour.

