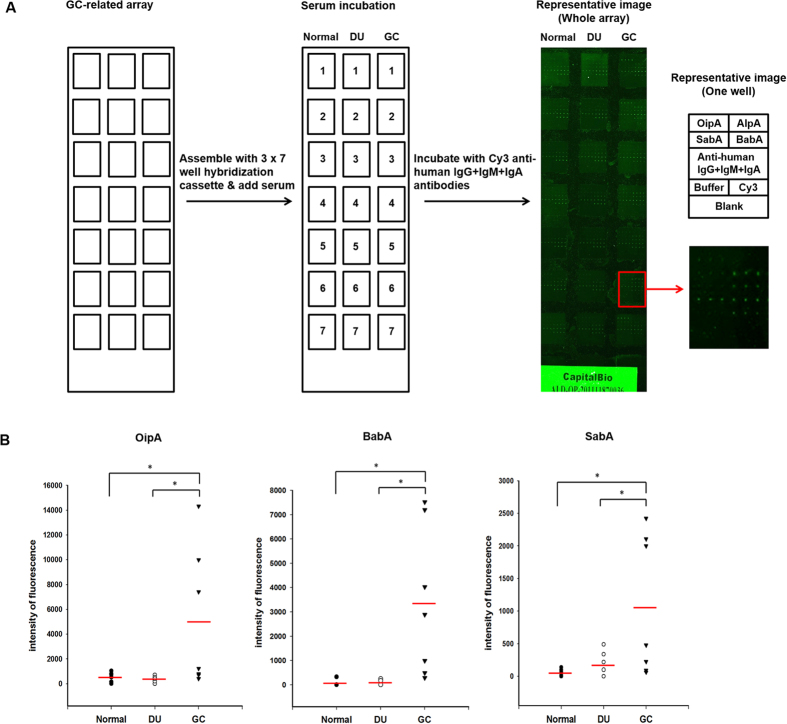
Figure 5. Microarray screening using OipA, BabA, and SabA distinguishes GC patients from DU patients or normal volunteers.
(A) Left, The selected antigens were purified and printed on a slide for fabrication of the GC-related protein microarray designed for a 3 × 7 well cassette. Middle, Individual serum samples from 7 normal individuals, 7 DU patients, and 7 GC patients were applied to individual wells. Right, The arrays were then incubated with Cy3-labeled anti-human IgG + IgM + IgA antibodies (green). The left panel shows a representative image of the probed GC-related array, while the panels on the right show a representative well, indicated in red on the left panel; the top panel shows the layout of the well and the bottom panel shows the result. Each antigen was printed in triplicate on the chip. Four concentrations of anti-human IgG + IgM + IgA antibodies (18.75–150 μg/ml) were used as positive controls, buffer was used as a negative control, and Cy3-labeled anti-mouse IgG was used as landmark. (B) Comparison of the seroreactivity of the samples from normal individuals, DU patients, or GC patients (n = 7 per group) with the three GC-related antigens, OipA, BabA, and SabA detected as the intensity of fluorescence of the Cy3-labeled anti-human IgG + IgM + IgA antibodies. *p < 0.05.

