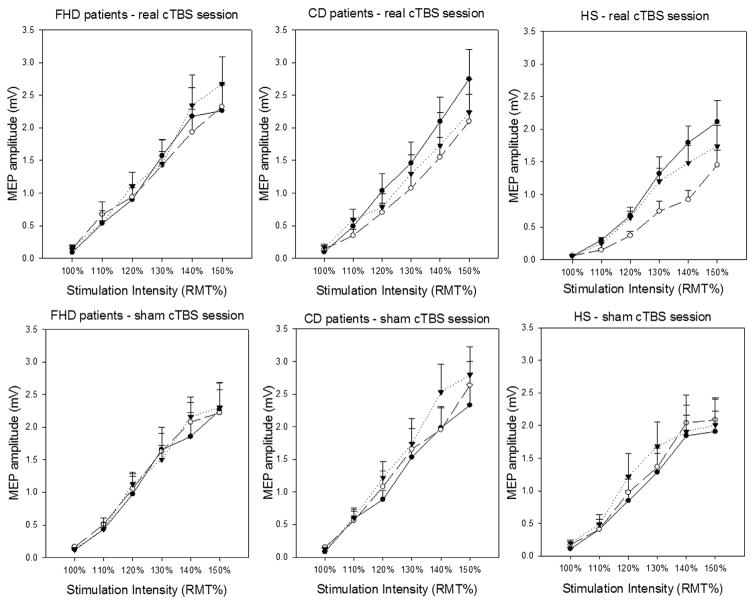
Fig. 1.
MEP input–output curve in FHD and CD patients and HS in the real and sham cerebellar cTBS sessions. Y axis indicates MEP amplitudes (mV); X axis indicates the stimulation intensities (from 100% to 150% resting motor threshold – RMT) in the two experimental sessions (real cerebellar cTBS – upper panels; sham cerebellar cTBS – lower panels) in patients with focal hand dystonia – FHD (left panels), in patients with cervical dystonia – CD (central panels) and in healthy subjects (HS) (right panels) at baseline (before cTBS), circular black symbols (continuous lines), at Post 1 (5 min after cTBS), circular white symbols (dashed lines), and at Post 2 (45 min after cTBS), triangular black symbols (dotted lines).

