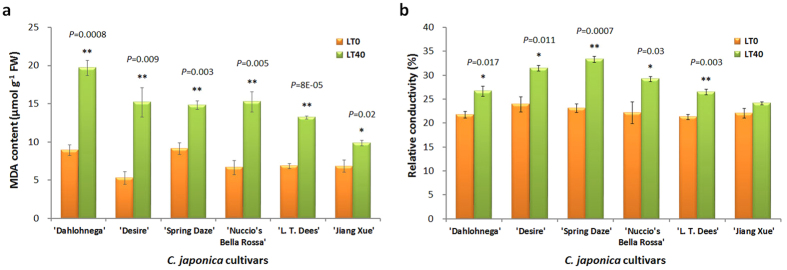
Figure 1. MDA and relative electrical conductivity change in different C. japonica cultivars that subjected to natural low temperature in 2013 winter.
LT0 and LT40 represent plant that subjected to low temperature for 0 day and 40 days, respectively. The bars represent the standard error (n = 3). * and ** indicate a significant difference between LT0 and LT40 at P < 0.05 and P < 0.01 levels, respectively (two tailed T-test).

