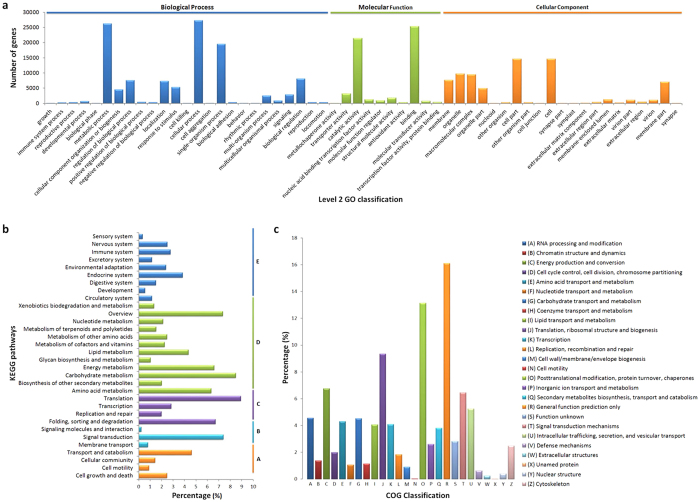
Figure 2. Functional annotation of assembled transcriptome.
(a) GO classification of the annotated unigenes. The Y-axis represents the number of genes in a category. (b) KEGG classification of the annotated unigenes. The left Y-axis indicates the KEGG pathways, the right Y-axis indicates the sub-branches. A: cellular processes; B: environmental information processing; C: genetic information processing; D: metabolism; E: organismal systems. The X-axis indicates the percentage of unigenes that were assigned to a specific pathway. (c) COG classification of the putative proteins. The Y-axis indicates the percentage of unigenes in specific functional cluster.

