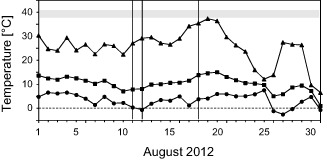
Figure 1.

Leaf temperatures of R anunculus glacialis measured in situ (2563 m a.s.l.) during August 2012. For each day, the maximum (triangles), mean (squares) and minimum (circles) half‐hourly mean values are depicted. Vertical lines indicate the days on which the diurnal course of the occurrence of chloroplast protrusions was investigated. The horizontal grey band indicates the temperature threshold that caused initial impairment of photosynthetic functions (after Larcher & Wagner 1976; Larcher et al. 1997; Buchner et al. 2014).
