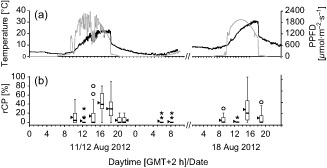
Figure 3.

Effect of sampling time on rCP in R anunculus glacialis. (a) Diurnal courses of leaf temperature (black line) and irradiation (grey line) at the in situ experimentation site (2563 m a.s.l.) on 11–12 and 18 Aug 2012. (b) rCP values of the samples taken at the respective time. Black bars inside boxes represent medians; bottoms of boxes indicate the 25th, the tops the 75th percentile; whiskers extend to 1.5 times box‐height; circles stand for outliers, asterisks for extreme outliers that have values more than three times box‐height; triangles indicate arithmetic means.
