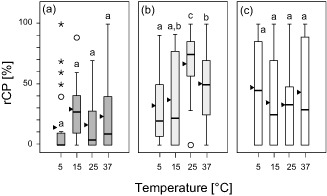
Figure 5.

Chloroplast protrusions in response to leaf temperature and irradiation intensity. Boxplots showing rCP during stepwise‐increased leaf temperatures. The experiments were conducted (a) in darkness (dark grey), (b) at PPFD 900 (light grey), and (c) at PPFD 1800 μmol photons·m−2·s−1 (white boxes). For each irradiation level, significant differences between mean values (anova, Duncan test, P < 0.05) are indicated by different characters; triangles indicate arithmetic means.
