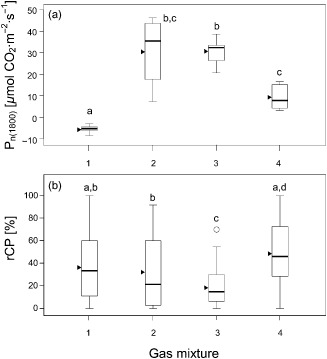
Figure 6.

Chloroplast protrusions and net photosynthesis rate in response to the ambient air CO2/O2 ratio. Data were derived from light–response curves that were obtained at different CO2/O2 ratios of the ambient air: Mixture 1: 50 ppm CO2/21% O2; Mixture 2: 2000 ppm CO2/21% O2; Mixture 3: 2000 ppm CO2/2% O2; Mixture 4 (control): 370 ppm CO2/21% O2. PPFD was increased stepwise from 0 to 1800 μmol photons·m−2·s−1. (a) Net photosynthesis rate P n(1800) at PPFD 1800 μmol photons·m−2·s−1 in response to the different CO2/O2 ratios. (b) rCP as determined at the end of the light–response curve as a function of the different CO2/O2 ratios). Significant differences between mean values (anova, Games–Howell post hoc test, P < 0.05) are indicated by different letters; triangles indicate arithmetic means.
