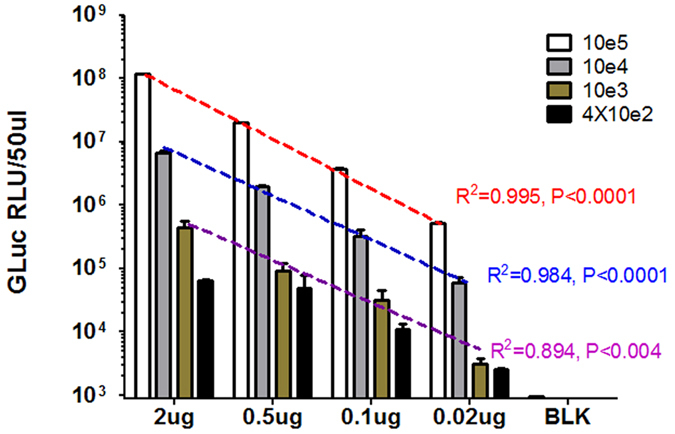
Figure 6. Titration of cell number and mcHBV-GLuc cccDNA plasmid dose in HepG2 cells.

1 million HepG2 cells were nucleofected with 2 ug, 0.5 ug, 0.1 ug, 0.02 ug of mcHBV-GLuc cccDNA (H-022 program). Cell concentration was then diluted to 10e5, 10e4, 10e3 and 4 × 10e2 cells/well in 96 well plates. And the GLuc activity was measured at day 3 post transfection. Data was mean ± s.e.m of duplications. BLK: blank control with no transfection.
