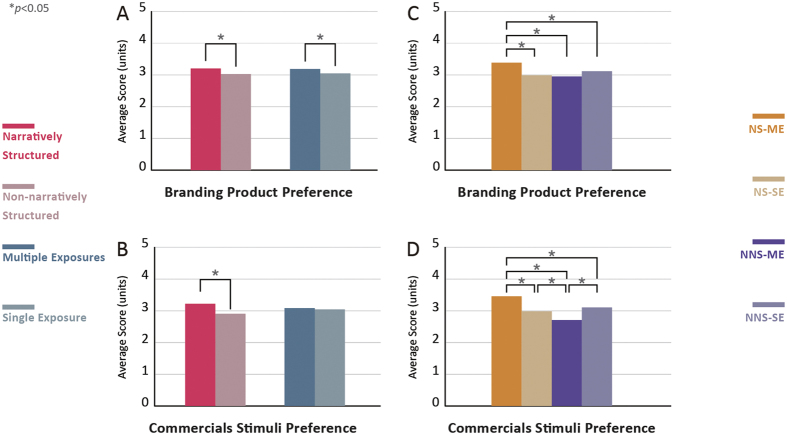
Figure 2. Statistical results of the behavioral data.
(A,B) The behavioral results of the 2 independent variables as assessed by independent samples t-tests for commercial stimuli and branding product preference. (C,D) The behavioral results of the 4 types of commercial stimuli as assessed by a one-way ANOVA for commercial stimuli and branding product preference. The highest preference scores for the branding product and the video commercial were found in the NS-ME group and the difference was statistically significant (p < 0.05). As can be seen in the behavioral results, a greater effect was observed in the narratively structured video commercials.

