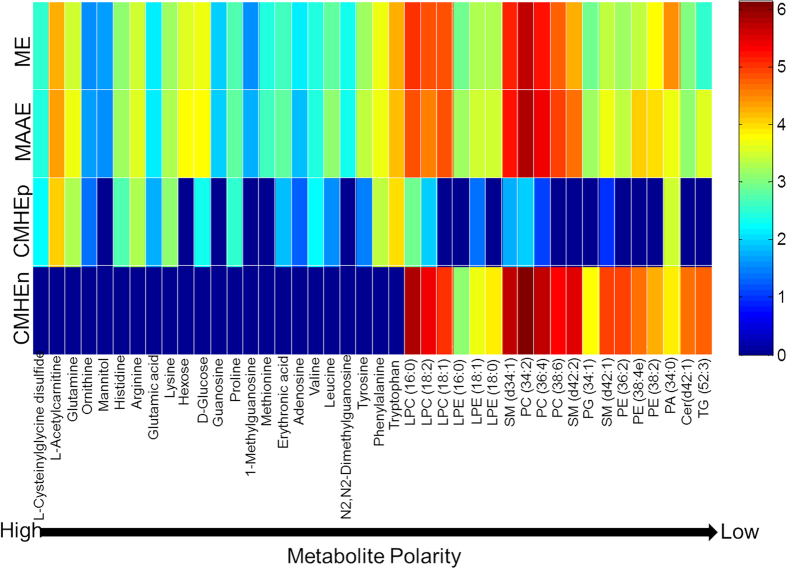
Figure 3. Comparison of the metabolite recovery of ME, MAAE and CMHE.
The peak areas of the 42 metabolites were normalized to the peak area of an ion (m/z = 427.39118, RT = 14.5 min) which could be detected in all the blanks and samples, and then multiplied by 10,000, followed by a base-10 log-transformation. Mean values from replicates were used for comparison.

