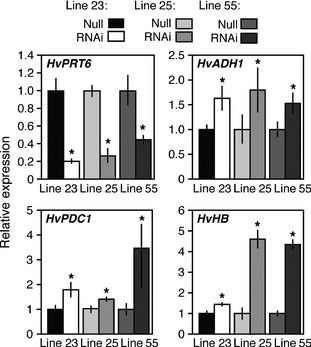
Figure 2.

qRT‐PCR analysis of the influence of the HvPRT6 RNAi construct on gene expression in independent barley homozygous RNAi lines compared to un‐transformed null segregant controls. Relative expression of HvPRT6, HvADH1, HvHB, HvPDC1. Transcript levels are shown relative to respective null segregants. In each case, error bars represent standard deviation of the mean. *P < 0.05.
