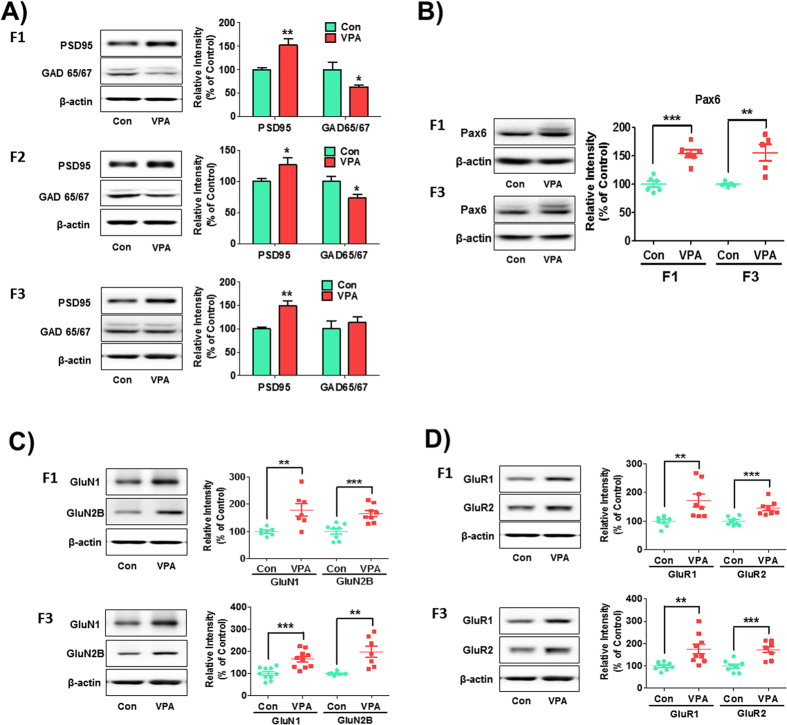
Figure 5. Increased expression of excitatory postsynaptic proteins in F1, F2 and F3 VPA-exposed mice.
Western blot analysis was performed using brain lysates from control and VPA-exposed mice of each generation at 4 weeks (A) for PSD95 [F1: n = 6 for Con and 5 for VPA; F2: n = 14 per group; F3: n = 5 for Con and 6 for VPA; all were randomly selected from 5–6 litters per group and per generation], and GAD 65/67 [F1: n = 8 per group; F2: n = 29 for Con and 24 for VPA; F3: n = 5 for Con and 6 for VPA; all were randomly selected from 5–6 litters per group and per generation]) and at E14 (B) for Pax6 [F1: n = 6 per group; F3: n = 5 per group; all were randomly selected from 5–6 litters per group and per generation]). Protein levels of NMDA (C) and AMPA (D) receptors were examined in the frontal cortex of F1 and F3 VPA-exposed mice offspring at postnatal week 4. To analyze the abnormalities in NMDA receptors, the protein levels of GluN1 (F1: n = 7 per group; F3: n = 10 per group; all were randomly selected from 6 litters per group and per generation) and GluN2B (F1: n = 8 per group; F3: n = 7 per group; all were randomly selected from 6 litters per group and per generation) were examined by Western blot. For AMPA receptors, the protein levels of GluR1 (F1: n = 8 per group; F3: n = 9 per group; all were randomly selected from 6 litters per group and per generation) and GluR2 (F1: n = 8 per group; F3: n = 8 per group; all were randomly selected from 6 litters per group and per generation) were examined. Cropped representative blots were shown for each protein of interest along with quantitative graphs of image analyses calculated as the percentage of expression relative to control groups normalized as 100%. *p < 0.05, **p < 0.01, ***p < 0.001 vs. control group as revealed by post-hoc Bonferroni’s comparisons.

