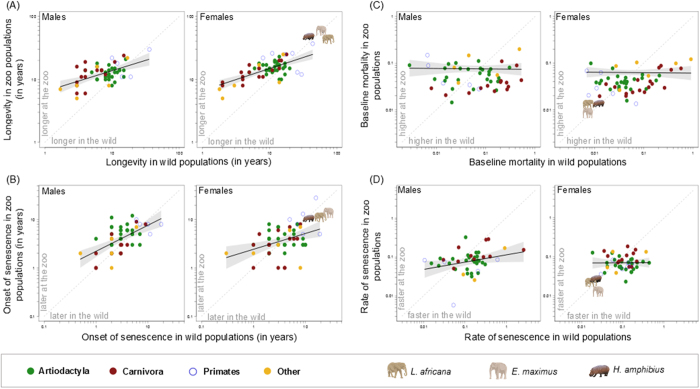
Figure 3.
Comparison of (A) longevity, (B) age at the onset of senescence, (C) baseline annual mortality, and (D) rate of senescence (for males and females, respectively) between zoo and wild populations of 59 mammalian species. Points represent raw data, full lines represent the relationship between captive and wild estimates (on a log scale with 95% confidence interval of the model in grey) and the grey dashed line represents the equation y = x. For females, African (Loxodonta africana) and Asian (Elephas maximus) elephants and hippopotamus (Hippopotamus amphibius) were added for illustrative purposes, but were not included in the analysis.

