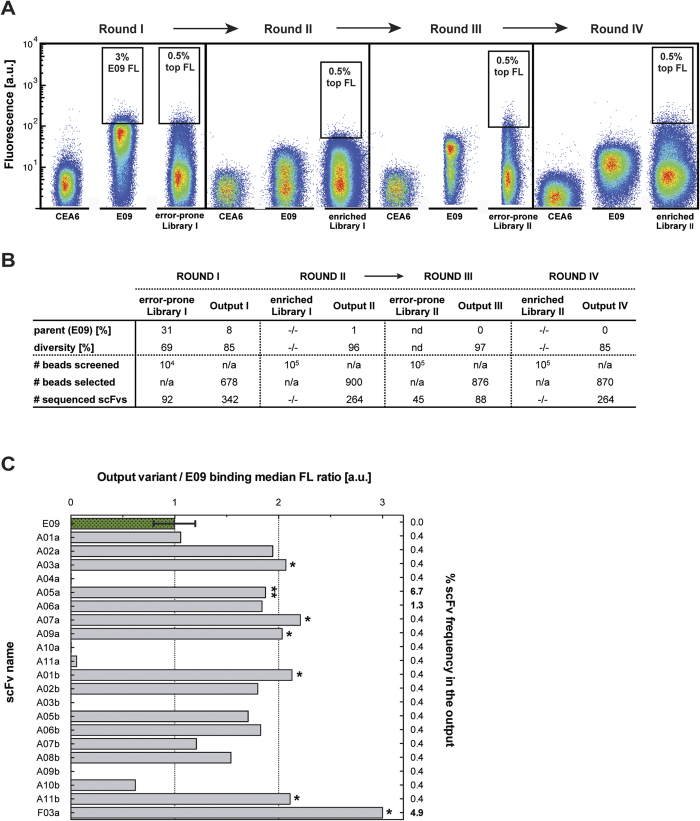
Figure 3. Overview of the scFv selections carried out by BeSD.
(A) Four selection rounds were carried out and the fluorescence distributions obtained by flow cytometry in each selection round are presented as density plots. In addition to the actual library in each round the non-binder (CEA6) and parent (E09) and were screened as controls (all in the presence of 1 nM FasR-Fc). The position of the sorting gate is indicated by a black box and the percentage of the sorted population falling into the gate is shown. (B) Summary of the selection campaign. The error-prone randomisation of the second selection round output is indicated with an arrow. Each output had high diversity of scFv amino acid sequence (with a decreasing proportion of parent E09 in each subsequent round). (C) 21 randomly selected scFvs from the fourth output were tested in on-bead binding assays. The plot shows the binding ratio of each variant over the E09 scFv (green bar, triplicate measurements), and the frequency of each variant in the selection output (numbers on right hand side). Seven scFvs either showing the largest improvements in binding (signal >2-fold higher than E09; marked with ‘*’) or appearing with the highest frequency in the output (marked with ‘**’) were expressed in E. coli and analysed biophysically (Table 1). Only one clone, F03a, failed in bacterial expression, and thus was not characterised.

