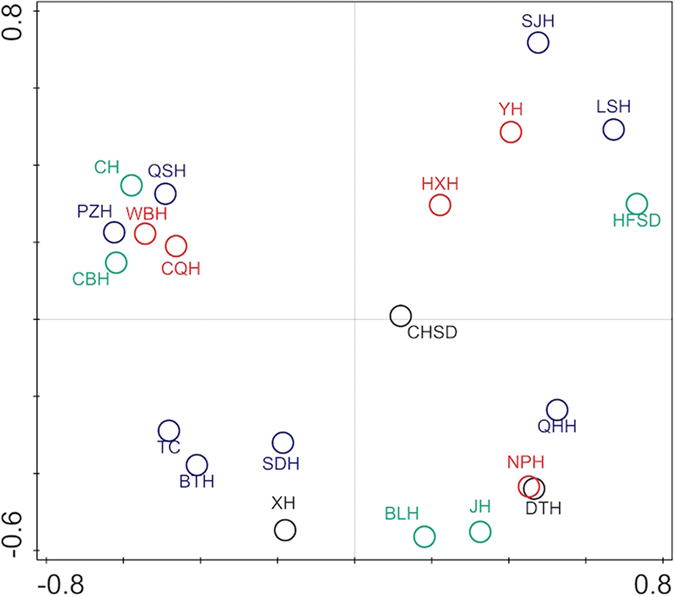
Figure 2.

PCoA plot of cyanobacterial OTUs0.03. PCo Axis 1 explained 21.93% of the variation; PCo Axis 2 explained 15.46% of the variation. Black nodes represent the lakes with a Shannon-Wiener diversity (H’) > 2; red nodes represent the lakes with a H’ between 1.5 and 2; blue nodes represent the lakes with a H’ between 1 and 1.5; green nodes represent the lakes with a H’ < 1.
