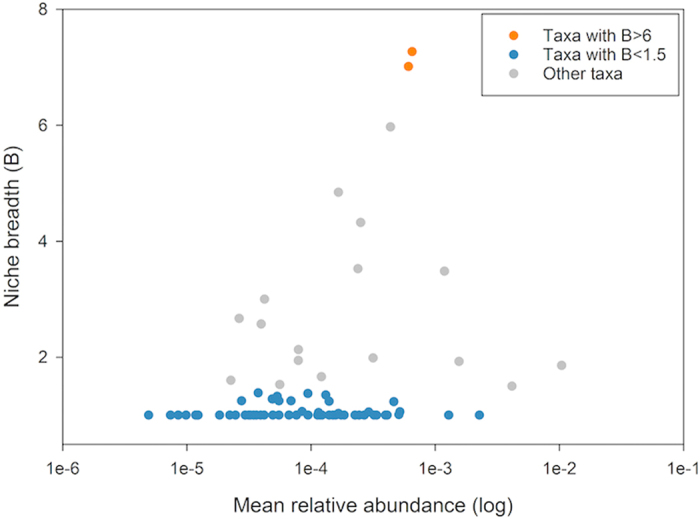
Figure 3. Niche breadth and mean relative abundance distribution of cyanobacteria.

Each dot represents a cyanobacterial OTU0.03. OTUs0.03 with a niche breadth >6 were indicated by orange dot. OTUs0.03 with a niche breadth <1.5 were indicated by blue dots. Other OTUs0.03 were indicated by grey dots.
