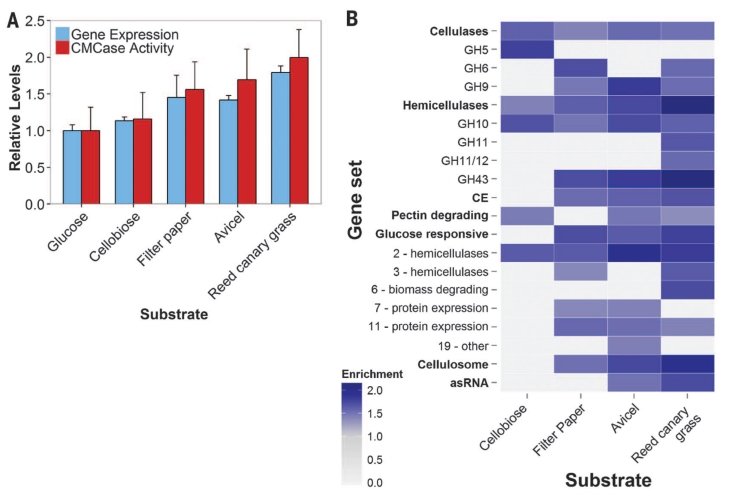
Fig. 4. Anaerobic fungi degrade complex substrates with increasingly diverse enzymes.
(A) Relative expression (FPKM) of biomass-degrading enzymes (table S1) and their activity (cellulosome fraction) on CMC. Data represent the mean ± SEM (error bars) of at least two replicates. (B) Normalized enrichment scores of positively enriched specified gene sets relative to growth on glucose. Gene sets containing genes that are expressed more highly in a given substrate are indicated (FDR ≤ 10%; Kolmogorov-Smirnov distribution). Enrichment scores are directly proportional to expression level. Gene sets shown in bold were analyzed in aggregate and in subsets (unbolded sets below). asRNA, antisense RNA that targets CAZy domains (Fig. 2A); Cellulosome, dockerin tagged transcripts. Numbers in the “Glucose responsive” subset indicate clusters.

