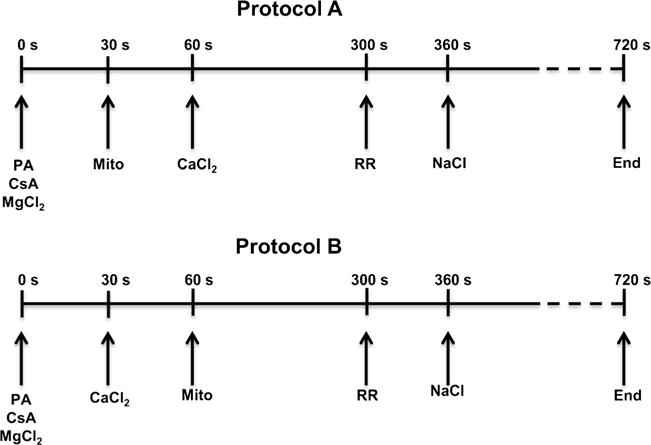
Fig. 1.

Timelines show the two experimental protocols used to characterize and quantify mitochondrial Ca2+ handling (influx, efflux, sequestration) in isolated guinea pig cardiac mitochondria. In protocol A, mitochondria were added to the experimental buffer before CaCl2 was added. In protocol B, mitochondria were added to respiration buffer with CaCl2 already present. All other additions were identical between protocols. 40 μM EGTA was present in all the experimental buffers; 0.5 μM CsA was added to all mitochondrial suspensions. Inset axes are the same as the main figure panels
