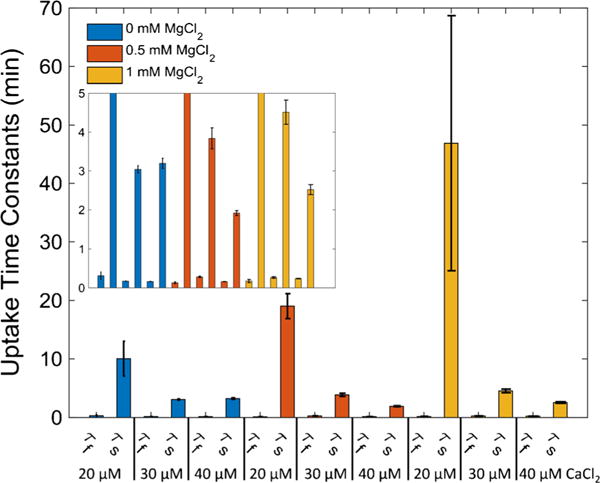
Fig. 3.

Two modes of Ca2+ uptake. For CaCl2 concentrations of 20 μM and greater, a double exponential function was fit between 65 s and 150 s to the [Ca2+]e dynamics observed in protocol A (Fig. 2). The fit time constants show that there was a fast and slow component of Ca2+ uptake associated with each bolus of CaCl2 administered. The inset axes labels are the same as the main figure panel. Error bars signify propagated standard deviations
