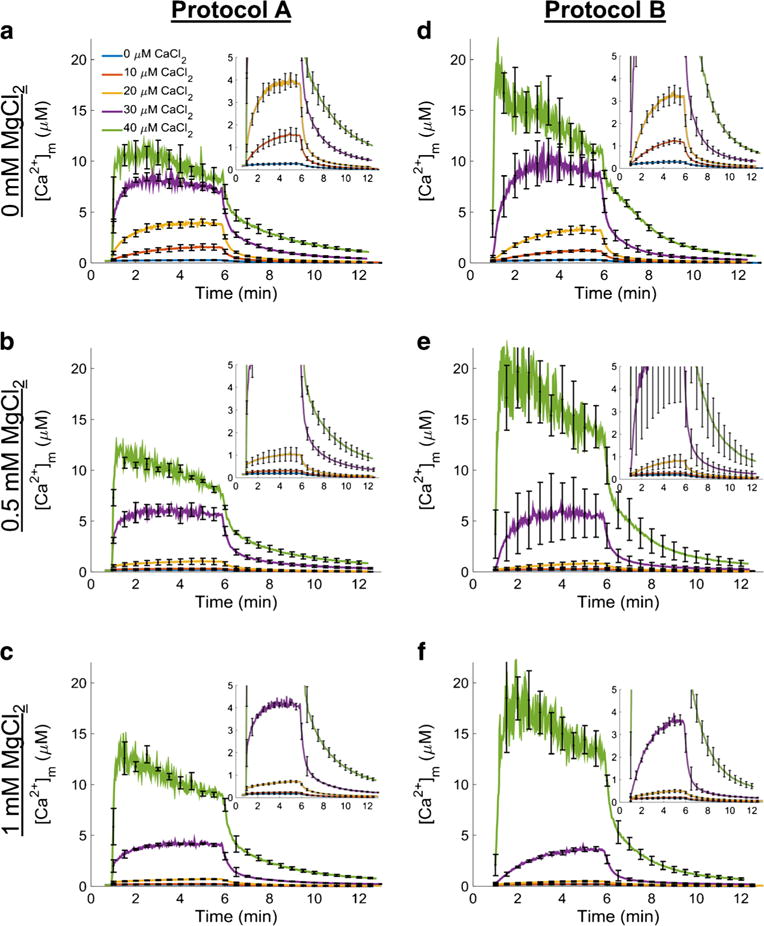
Fig. 4.

Matrix free Ca2+ ([Ca2+]m) dynamics. Ca2+ uptake and Ca2+ release for each combination of CaCl2 and MgCl2 concentrations are shown using the protocol depicted in Fig. 1. CaCl2 was added to the respiring mitochondrial suspension (left column; protocol A) or mitochondria were added to the buffer containing a given CaCl2 concentration (right column; protocol B) at 60 s followed by ruthenium red (RR) at 300 s and NaCl at 360 s. The results for protocol A are shown in the left column and the results for protocol B in the right column. In protocol B when CaCl2 was 40 μM, the fluorescent signal was close to Rmax, so the calculated [Ca2+]m is likely an overestimation of the true value of [Ca2+]m. Each row corresponds to the buffer MgCl2 indicated on the left of each row. Insets show [Ca2+]m dynamics for 0, 10, and 20 μM CaCl2 in more detail. The axes are the same as the axes in the main figure panels. Error bars signify standard error of the mean
