
Fig. 5.
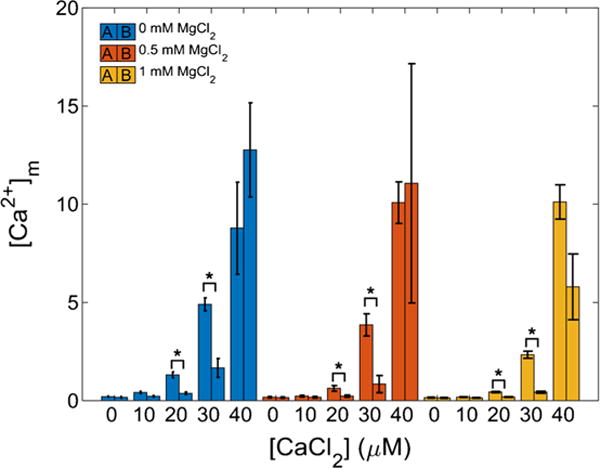
Ca2+ uptake by mitochondria. The amount of Ca2+ uptake by mitochondria depends on method of CaCl2 delivery. The bar plots show [Ca2+]m just after addition of CaCl2 to mitochondria (protocol A, left bar) or after addition of mitochondria to buffer containing CaCl2 (protocol B, right bar). These data correspond to a time of approximately 65 s. For all 20 and 30 μM CaCl2 conditions, the rate of Ca2+ uptake in protocol A was significantly different from that of protocol B (p ≤ 0.05) for most of the [CaCl2] and even in the presence of Mg2+. Error bars signify standard error of the mean