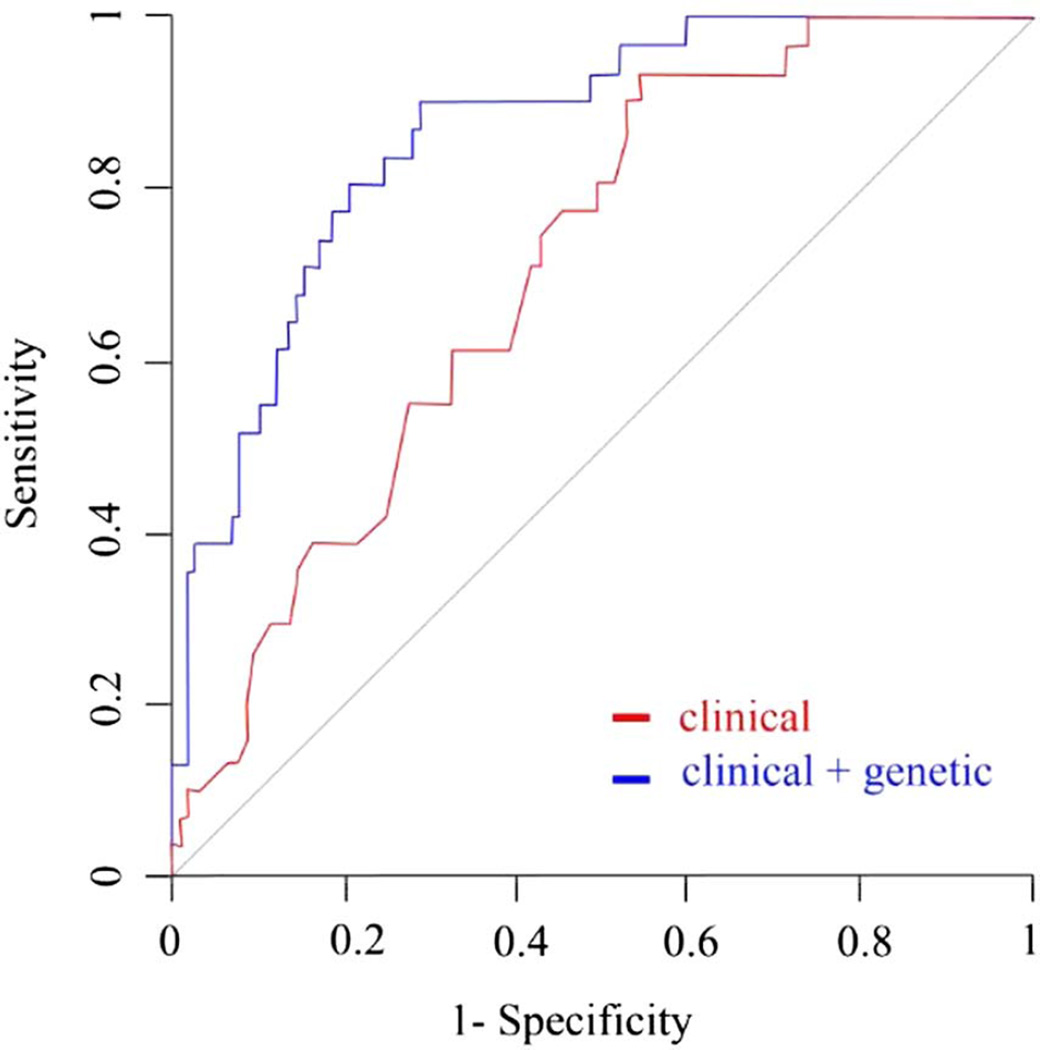
Figure 2.
ROC curves for prediction of ICD incidence in patients using dopamine agonists. The red ROC curve was plotted with clinical variables only (age, gender, DRT and duration of follow-up period). The blue ROC curve was plotted with clinical and genetic variables combined. The genetic variables consisted of genotype data on 13 preselected SNPs. p Value refers to AUC comparison of the two curves. AUC, area under the curve, DRT, dopamine replacement therapy; ICD, impulse control disorders; ROC, receiver operating characteristic SNPs, single nucleotide polymorphisms.

