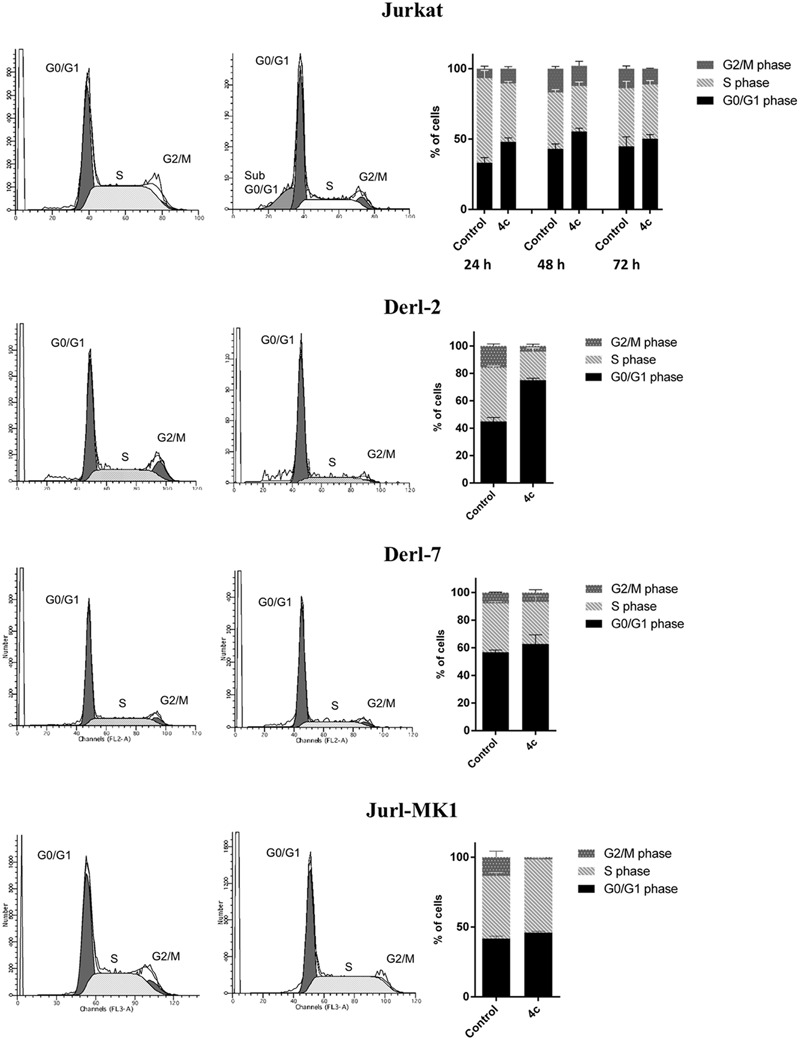
FIGURE 3.

Cell cycle analysis in hematological malignancies after 4c compound treatment. Cell cycle analysis was evaluated by flow cytometer in Jurkat cell line after 4c compound or DMSO vehicle treatment at 2 μM for 24, 48, and 72 h; in Derl-2 and Derl-7 after treatment at 4 μM for 72 h; in Jurl-MK1 after treatment at 1 μM for 72 h. Histogram plots show a single representative experiment, the bar-graphs represent mean with SD from three independent experiments.
