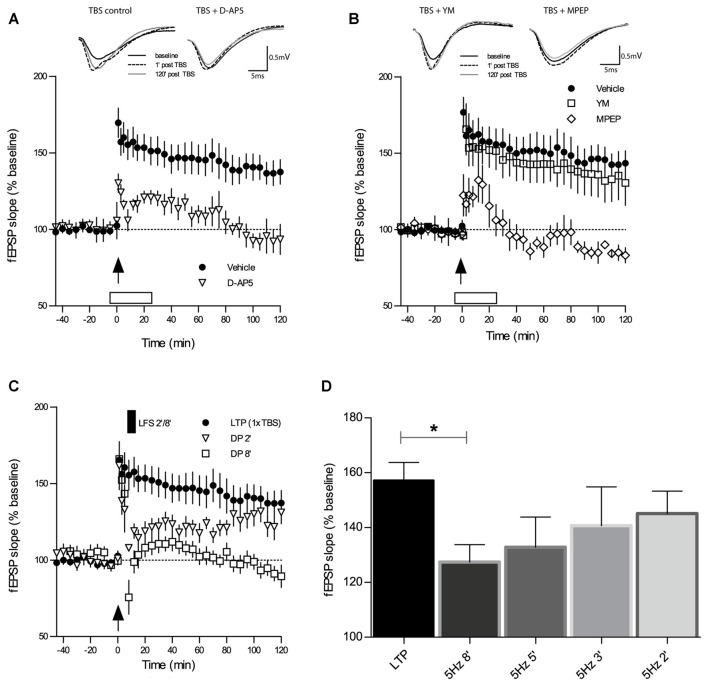
Figure 1.
Theta-burst-stimulation (TBS)-induced long-term potentiation (LTP) is sensitive to inhibition of N-methyl-D-aspartate receptors (NMDAR) and metabotropic glutamate receptor 5 (mGluR5) but not of mGluR1. (A) The selective NMDAR antagonist D-AP5 (50 μM) causes a marked impairment of LTP (n = 7) induced by a single TBS (indicated by an arrow) when compared to the vehicle group of slices (n = 13). Error bars represent SEM, p = 0.0285. (B) Inhibitors of mGluR1 and mGluR5 have contrasting effects on TBS-LTP. Whereas the mGluR1 inhibitor YM 298198 (1 μM) does not affect TBS-LTP (n = 6), the GluR5 inhibitor 2-Methyl-6(phenylethynyl) pyridine (MPEP; 40 μM) causes a profound blockade of TBS-LTP (n = 6) compared to vehicle (n = 13; same group of slices for vehicle application as in 1A). Error bars represent SEM, p < 0.0001. Traces show representative examples of field excitatory postsynaptic potentials (fEPSPs) recorded during baseline (black line), 1 min post-TBS induction (broken line) and 120 min post-TBS (gray line). Calibration bars: 0.5 mV and 5 ms. Open box indicates time and duration of drug application for 30 min, from 6 min before tetanization until 24 min thereafter. (C) Depotentiation (DP) induced by a single TBS (1×TBS) followed by low-frequency stimulation (LFS) at 5 Hz for 2 min (DP2) evoked only a short-lasting depression of fEPSPs that was not significantly different from LTP controls (main effect of group: F(1,19) = 2.77, p = 0.1122; RM-ANOVA on 120 min post-LFS). In contrast, LFS for 8 min (DP8) caused a significant DP (F(1,20) = 17.13, p = 0.0005; RM-ANOVA). (D) The magnitude of in vitro DP depends on the duration of LFS (5 Hz). By varying the duration of LFS (always applied from 6 min after LTP induction), an “LFS duration-response curve” was observed wherein longer trains resulted in stronger DP (control LTP, n = 10; LFS 2 min (DP2), n = 8; LFS 3 min, n = 7; LFS 5 min, n = 7; LFS 8 min (DP8), n = 8). Bar graphs represent the remaining percentage of potentiation measured in each conditioning group 90 min after TBS application. Note that DP8 protocol was the most effective in generating a robust DP when compared to control LTP. Error bars represent SEM, p = 0.0206; *p ≤ 0.05.

