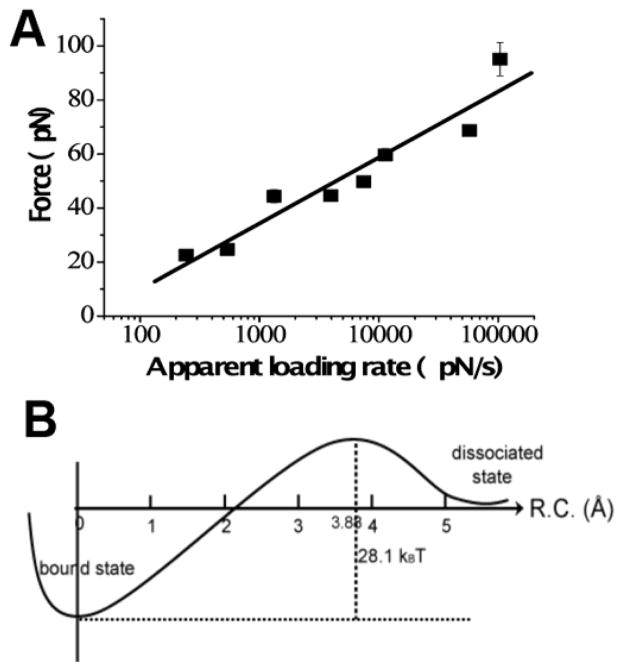
Figure 7. DFS analysis of α-Syn interactions.
(A) DFS plot for AFM probing of α-Syn interactions measured at pH 5.1. The linear relationship indicates that the dissociation of an α-Syn dimer follows a one-barrier path shown in (B). The energy of the barrier is 28.1 kBT; the complex lifetime is 0.27 ± 0.13 s. The figure was reproduced from [47]. Copyright © 2008, Elsevier Ltd..

