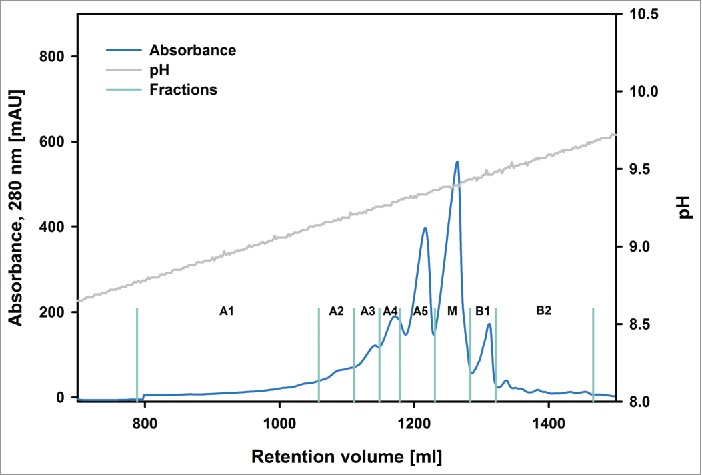
Figure 1.

Preparative chromatogram of batch “Newton.” The blue trace indicates UV absorbance. A1-A5, M, B1-B2 denotes the collection of acidic, the main and basic variants, respectively. The fractionation boundaries are represented by turquoise lines. The gray trace shows the pH.
