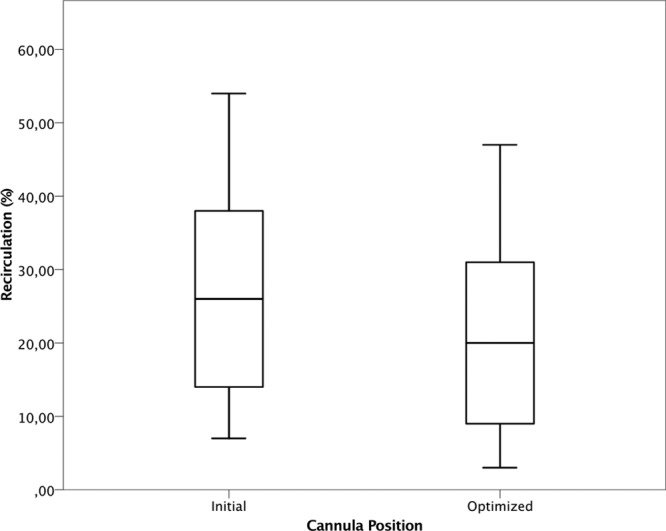
Figure 4.

Pooled distribution data on recirculation fraction at initial 28.5 ± 15.6% (mean ± SD) and after optimization 21.3 ± 13.6% of the draining cannula independent of design (n = 13), p = 0.05.

Pooled distribution data on recirculation fraction at initial 28.5 ± 15.6% (mean ± SD) and after optimization 21.3 ± 13.6% of the draining cannula independent of design (n = 13), p = 0.05.