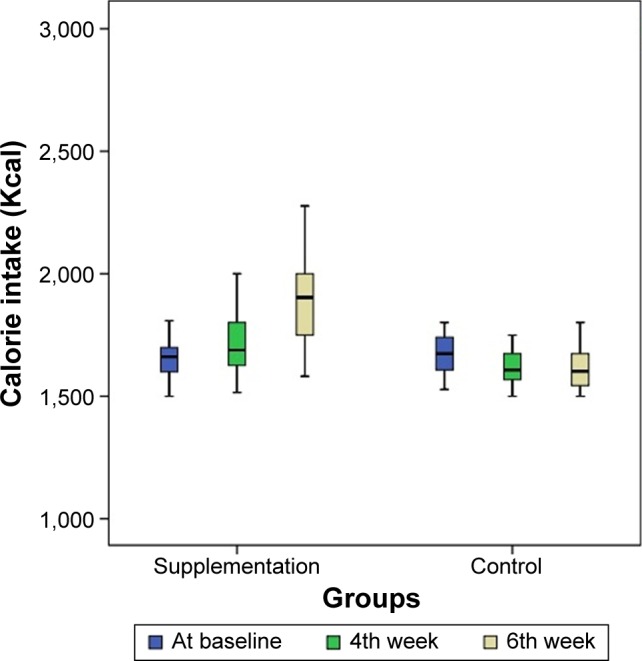
Figure 3.

Charts demonstrating the trend of calorie intake changes during the study in supplementation and control groups.
Note: Patient’s calorie intake at the beginning (blue), 4th week (green), and 6th week (milky) chart.

Charts demonstrating the trend of calorie intake changes during the study in supplementation and control groups.
Note: Patient’s calorie intake at the beginning (blue), 4th week (green), and 6th week (milky) chart.